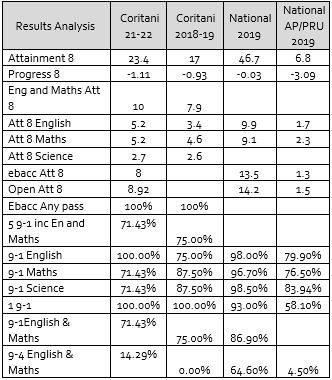
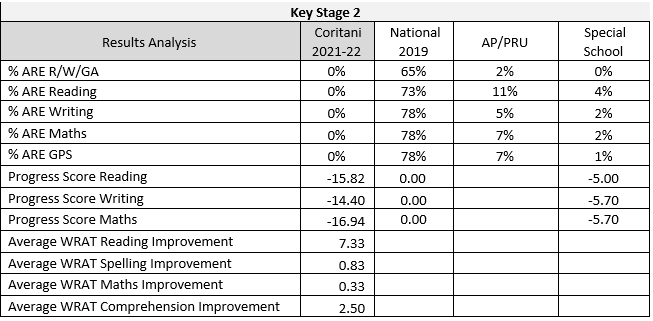
Results 2017 onwards
Results Analysis 2016-2019 |
Coritani 2018-19 |
Coritani 2017-18 |
Coritani 2016-17 |
National (All Pupils) |
National AP/PRU |
---|---|---|---|---|---|
Attainment 8 |
17 |
16.13 |
12 |
44.6 |
6.2 |
Progress 8 |
-0.93 |
-0.90 |
-2.20 |
-0.08 |
-3.10 |
5 9-1 Including English and Maths |
75% |
75% |
87.5% |
|
|
9-1 English |
75% |
100% |
100% |
98% |
79.90% |
9-1 Science |
87.5% |
100% |
|
98.5% |
83.94% |
9-1 Maths |
87.5% |
75% |
100% |
96.70% |
76.50% |
1 9-1 Grades |
100% |
75% |
100% |
93% 2015 |
|
9-1 English & Maths |
75% |
75% |
87.5% |
86.9% 2015 |
|
9-4 English & Maths |
0% |
12.5% |
0% |
65.10% |
4.50% |
Average time at Coritani (Months) |
14.4 |
9.8 |
8.5 |
|
|
Average sessions per week |
8.8 |
8.4 |
8.6 |
|
|
Attendance |
77.37% |
84.35% |
86.2% |
94.50% |
64.70% |
Average increase in Attendance |
30.9% |
38.9% |
33.7% |
|
|
PAs (10%) |
50% |
50% |
47% |
12.8% |
71.80% |
Exclusions on Entry (Previous year-days) |
144 |
75 |
120 |
|
|
NEET |
0% |
0% |
12.5% |
5% |
44% |
Current Fixed Term Exclusions (number) |
40 |
10 |
21 |
|
|
Current Fixed Term Exclusions (students) |
5 |
5 |
8 |
|
|
Rate of Exclsuions (exclusions/number of pupils) |
148.15 |
41.67 |
84 |
4.29 |
155.84 |
1 or more FT Exclusions |
18.52 |
20.83 |
32 |
2.11 |
58.15 |
Permanent Exclusion Rate |
0 |
0 |
0 |
0.17 |
0.14 |
Levels of Progress from Starting Point at Coritani
2018-19 |
2017-18 |
2016-17 |
|
---|---|---|---|
English |
0.5 |
1.7 |
1.1 |
Maths |
0.7 |
1.5 |
0.6 |
Science |
1.3 |
2.0 |
0.7 |
PP English |
1.5 |
1.8 |
0.8 |
PP Maths |
1.6 |
1.4 |
0.3 |
PP Science |
1.7 |
1.6 |
0.6 |
None PP English |
-0.5 |
1.6 |
2.0 |
None PP Maths |
-0.3 |
1.6 |
1.5 |
None PP Science |
1.0 |
2.6 |
0.8 |
EHCP English |
-0.2 |
4.0 |
0.9 |
EHCP Maths |
0.2 |
2.3 |
0.7 |
EHCP Science |
0.4 |
3.7 |
0.5 |